What does Return on Total Assets Mean?
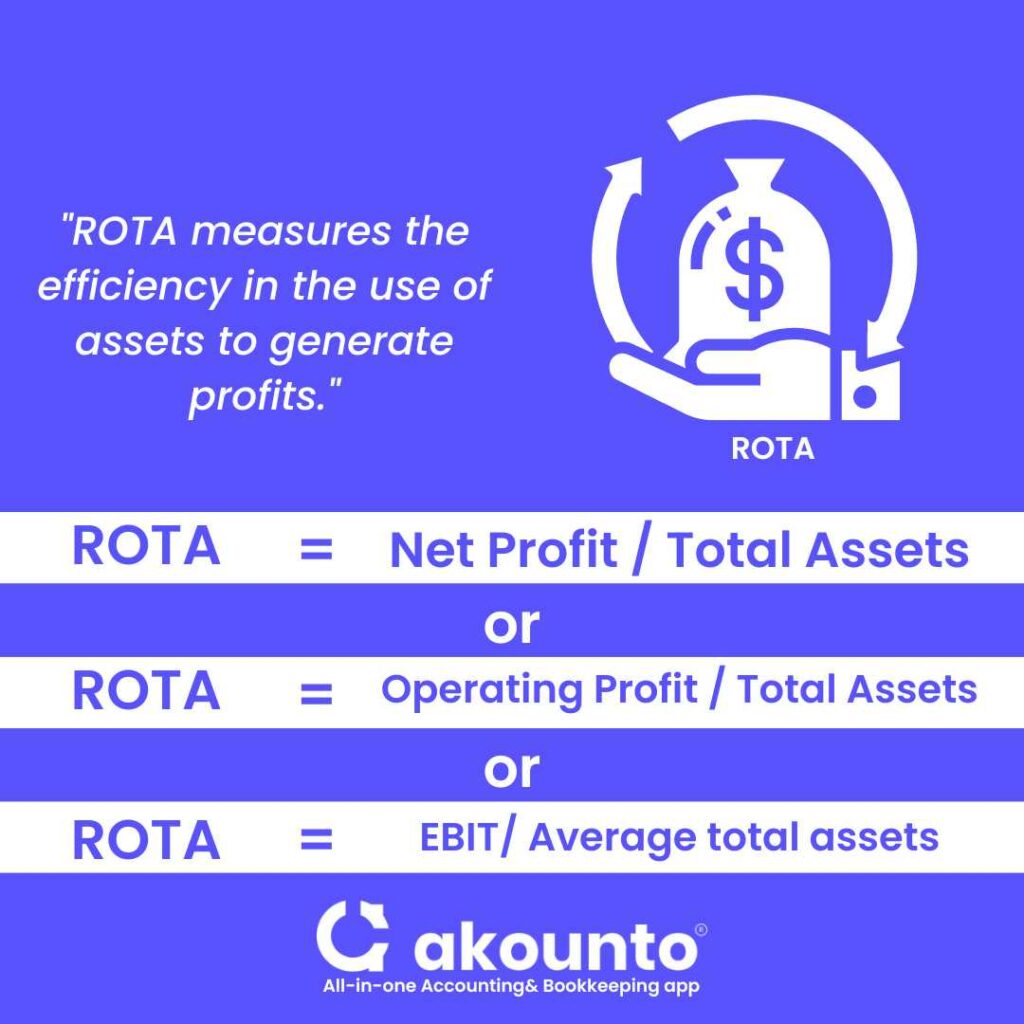
Return on Total Assets (ROTA) is a financial ratio obtained by dividing EBIT by Average total assets to measure the use of assets in generating profits.
Return on total assets helps to understand the company’s efficiency and effectiveness in utilizing its assets to generate profits.
ROTA (ROA) is one of the financial ratios that help in inter-company and intra-company comparisons. Stakeholders like analysts and investors seek ROTA to compare the nature of a company’s earnings and profitability with similar companies in the industry.
ROTA within the organization is used to measure and compare the efficiency of the management in using assets to generate earnings over a period.
Relevance and Uses
Return on Total Assets (ROTA) is important for measuring financial performance in terms of assets employed. It is a widely used financial metric; some of its uses are:
- Measuring asset utilization: Using ROTA, stakeholders can assess a company’s asset utilization efficiency. This assessment can help understand how the business is doing and where it might need to make operational improvements. It demonstrates how profitably the business uses its resources.
- Comparison with industry standards: ROTA enables investors to compare a company’s profitability to competitors in the same industry. This comparison enables analysts and investors to compare similar companies to the industry benchmarks.
- Measuring profitability: ROTA is a profitability ratio that measures a company’s return against the assets deployed in the running business operations. Operating profit includes the impact of the company’s debt as they are a fixed outflow of funds in the form of interest expenses, showing the company’s operational efficiency in managing the assets.
- Improvement tool: Return on total assets evaluate the company’s performance by considering operating profit (net profit) and average assets and comparing it with the industry benchmarks. This helps to highlight the areas where the company is underperforming and improve the efficiency of business verticals.
What Is a Good ROA?
Ideal ROA will be different for various industries. All industries have different financing differences based on their debt structures, but similar financing patterns can be seen within a sector.
Sectoral financial patterns are similar, like all heavy industries and capital-intensive companies will tend to have a lower return on total assets as their cash cycle, collections, and projects sometimes span years. Compared with sectors like FMCG and white goods, they usually have a higher ratio.
Thus, the ideal ratio for ROA will vary as per the sector and then the stage or turnover of the company, model of investment, growth potential, operating market size, etc. Different businesses manage assets differently as per their business models.
Generally, a Return on total assets of around 5% is considered a good ROA. Within the same industry, it should be near the sectoral benchmark. The higher the ROTA ratio, the better it is. A lower percentage signifies efficiency in using the company’s assets.
In practical usage, ROTA is considered in conjunction with ROE and Net Profit Margin, which can be seen in the case of the DuPont Formula.
Return on Total Assets Formula and Example

Return on total assets formula = ROTA = Net Profit / Total Assets
ROTA calculates the percentage of profits earned in relation to the company’s total assets.
The return on total assets formula is as follows:
ROTA = Operating Profit / Total Assets
Operating profit is also written as EBIT, so another variation in the calculation of return on total assets formula is:
ROTA = EBIT/ Average total assets
The resultant of the division is multiplied by 100 to calculate ROTA in percentage.
Understanding the Components of the Return on Total Assets Formula
EBIT (Operating Earnings / Operating Profit / Operating Income)
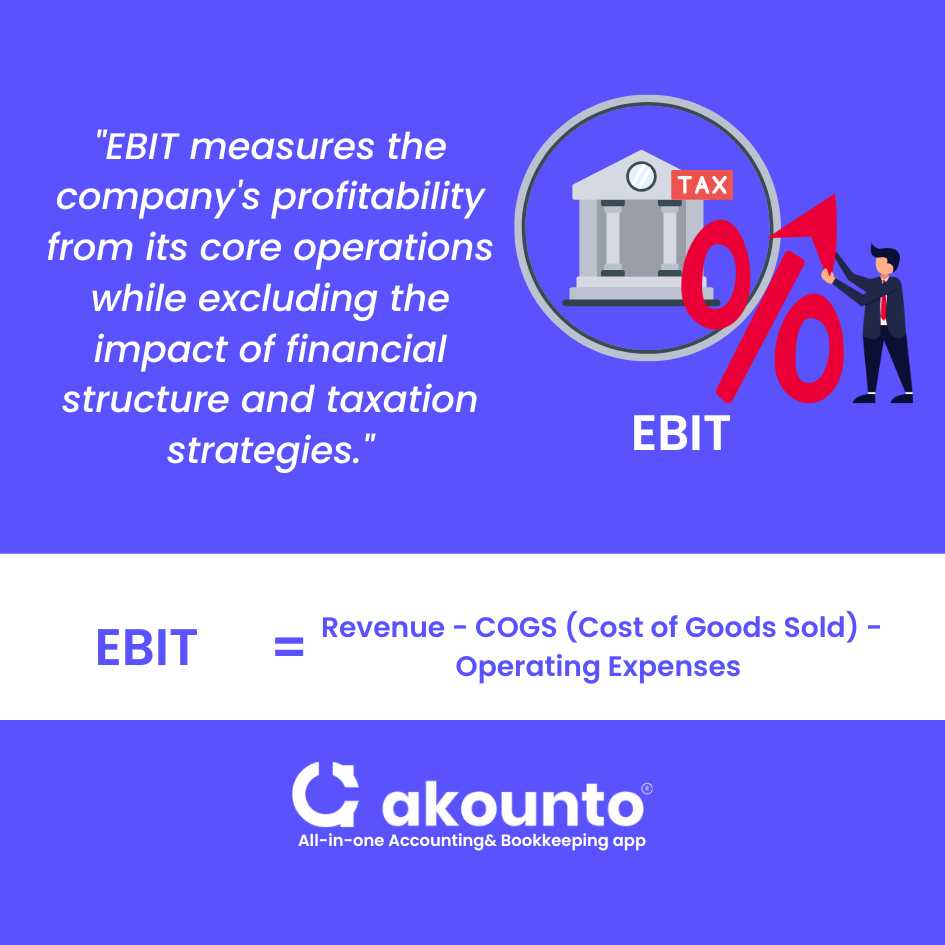
EBIT refers to Earnings Before Interest and Taxes and is a financial metric representing a company’s operating income calculated by subtracting operating expenses and COGS (cost of goods sold) from the company’s revenue (operating profit). The revenue is taken before the deduction of interest expense and income tax. EBIT is the company’s profits after deducting all expenses and taxes.

EBIT = Revenue – COGS (Cost of Goods Sold) – Operating Expenses
EBIT can be easily obtained from the company’s income statement. Otherwise, the user can take revenue from the income statement and add interest expense and taxes paid to calculate operating income.
EBIT measures the company’s profitability from its core operations while excluding the impact of financial structure and taxation strategies.
Average Total Assets
Average total assets depict the company’s total assets change in an accounting period. The opening and closing amounts of the assets from the company’s balance sheet are divided by two.
Total assets include all current and noncurrent assets, such as cash, accounts receivable, inventory, property, plant, and equipment.
Average total assets = (Opening balance of Assets + Closing Balance of Assets)/ 2
Practical Examples
Example 1:
Ashley is an investor and is analyzing the profitability, and she wants to calculate the ROA of ABC Inc. Help her to calculate ROA from the information:
EBIT as reported in Income Statement = $ 75,000
Assets at the beginning of the accounting year = $ 190,000
Assets at the end of the accounting year = $ 210,000
Solution
Operating Earnings as given from Income Statement = EBIT = $ 75,000
Average total assets = (190,000 + 210,000)/ 2 = $ 200,000
Company’s ROA = 75,000/ 200,000= 0.375 * 100 = 37.5%
Example 2:
Company X reported the following financial details at the end of an accounting period:
- Information from Income Statement
- Net income: $ 90 million
- Interest expense: $ 3 million
- Taxes paid: $ 2 million
- Information from Balance Sheet
- Assets at the beginning of the accounting year: $ 110 Million
- Assets at the of the accounting year: $ 130 Million
Calculate the return on total assets for the given accounting period.
Solution
Return on total assets formula = EBIT/ Average total assets
Calculation of EBIT = Net Income + Interest expense + Taxes paid
EBIT = 90 + 3 + 2 = $ 95 Million
Average total assets = (Opening balance of Assets + Closing Balance of Assets)/ 2
Average total assets = (110 + 130)/ 2 = 120
Calculate ROTA = 95/ 120 = 0.7916 * 100 = 79.16%
Advantages & Limitations of Return on Total Assets
Advantages
- Easy to use and understand: Return on total assets is simple and links average assets with operating income. Due to the ease of use, return on assets is widely used by investors.
- A broad view of profitability: ROTA considers average assets, which includes all current and noncurrent assets; thereby, the short-term and long-term impact of asset deployment can be easily studied, and a comprehensive view of management’s operations is highlighted.
- Benchmarking: Sectoral benchmarks make it easy for comparison and analysis.
- Useful for evaluating capital allocation and capital budgeting decisions.
Limitations
- Ignoring risk and cost of capital by excluding interest payments and payments in return to the equity shareholders may result in overestimating a company’s profitability.
- Manipulation: Return on assets can be manipulated by adjusting the valuation of assets impacting average assets or manipulating net income, which leads to misreporting.
- While considering average assets, ROTA cannot classify the asset class and quality in the long run. A high-quality and long-lasting asset generates higher returns than a low-quality asset.
ROA vs ROE
| Basis of Differentiation | Return on Assets (ROA) | Return on Equity (ROE) |
| Definition | ROA is the measure of profitability in relation to asset utilization. It measures the profit made on every dollar of assets maintained by the company. | ROE is the measure of profitability in relation to equity. It measures the profit made on every dollar of a shareholders’ equity. |
| Formula | Operating Income / Total Assets | Net Income / Total Equity |
| Focus | Efficiency in managing the company’s assets. | Returns on the equity invested. |
| Numerator | Operating Income | Net Income |
| Denominator | Average Total Assets | Average Total Equity |
| The debt component of interest expenses | It takes into account debt leverage in the calculation. | Debt is excluded from the calculation of ROE. |
| Analysis | Analysis of overall profitability and operational efficiency | Analysis of the company’s ability to generate returns for its shareholders |
Conclusion
Return on total assets highlights the management’s efficiency in utilizing assets. Investors utilize it for making investing decisions. A small business should monitor ROTA as it impacts internal and external stakeholders. Signaling a venture capitalist or financer or simply optimizing internal efficiency, analysis of return on total assets is important.
Use Akounto for recording and bookkeeping. Akounto’s accounting software offers numerous features like an intuitive dashboard where you can glance at the financial situation of a business quickly, be it expenses, account balances, mapping projected profits, etc.


